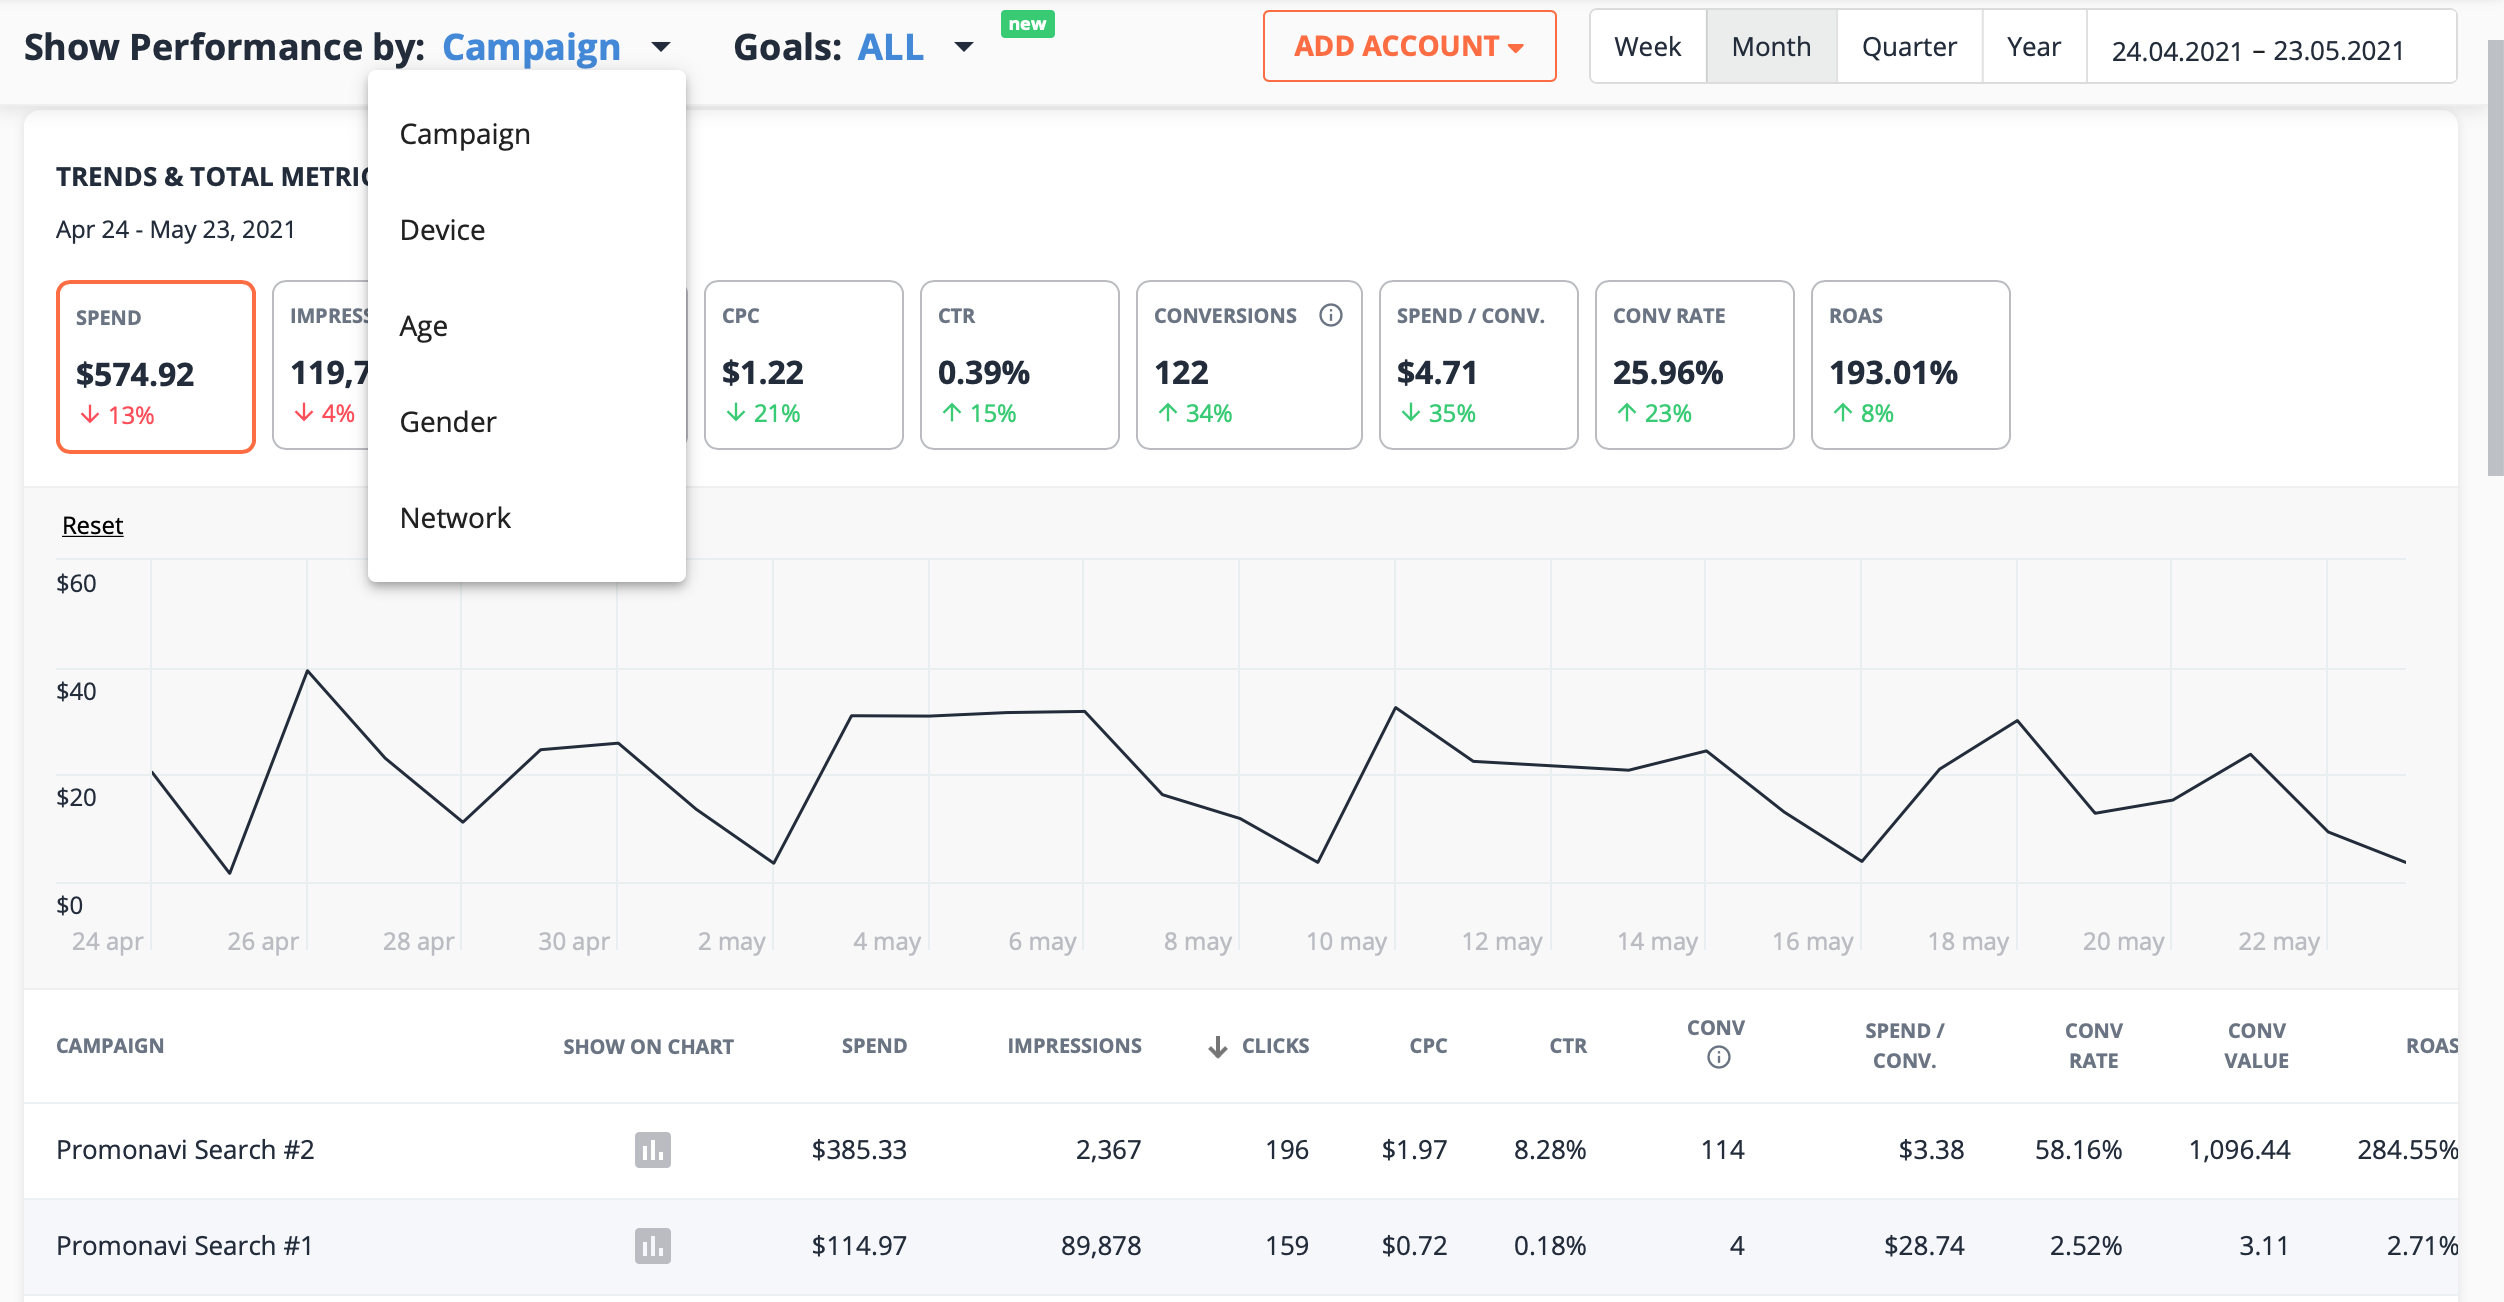
The dashboard gives you an overview of how your campaigns are doing over a specific time frame. You may select the time frame above the chart, choosing a set timeframe or by choosing the timeframe manually.
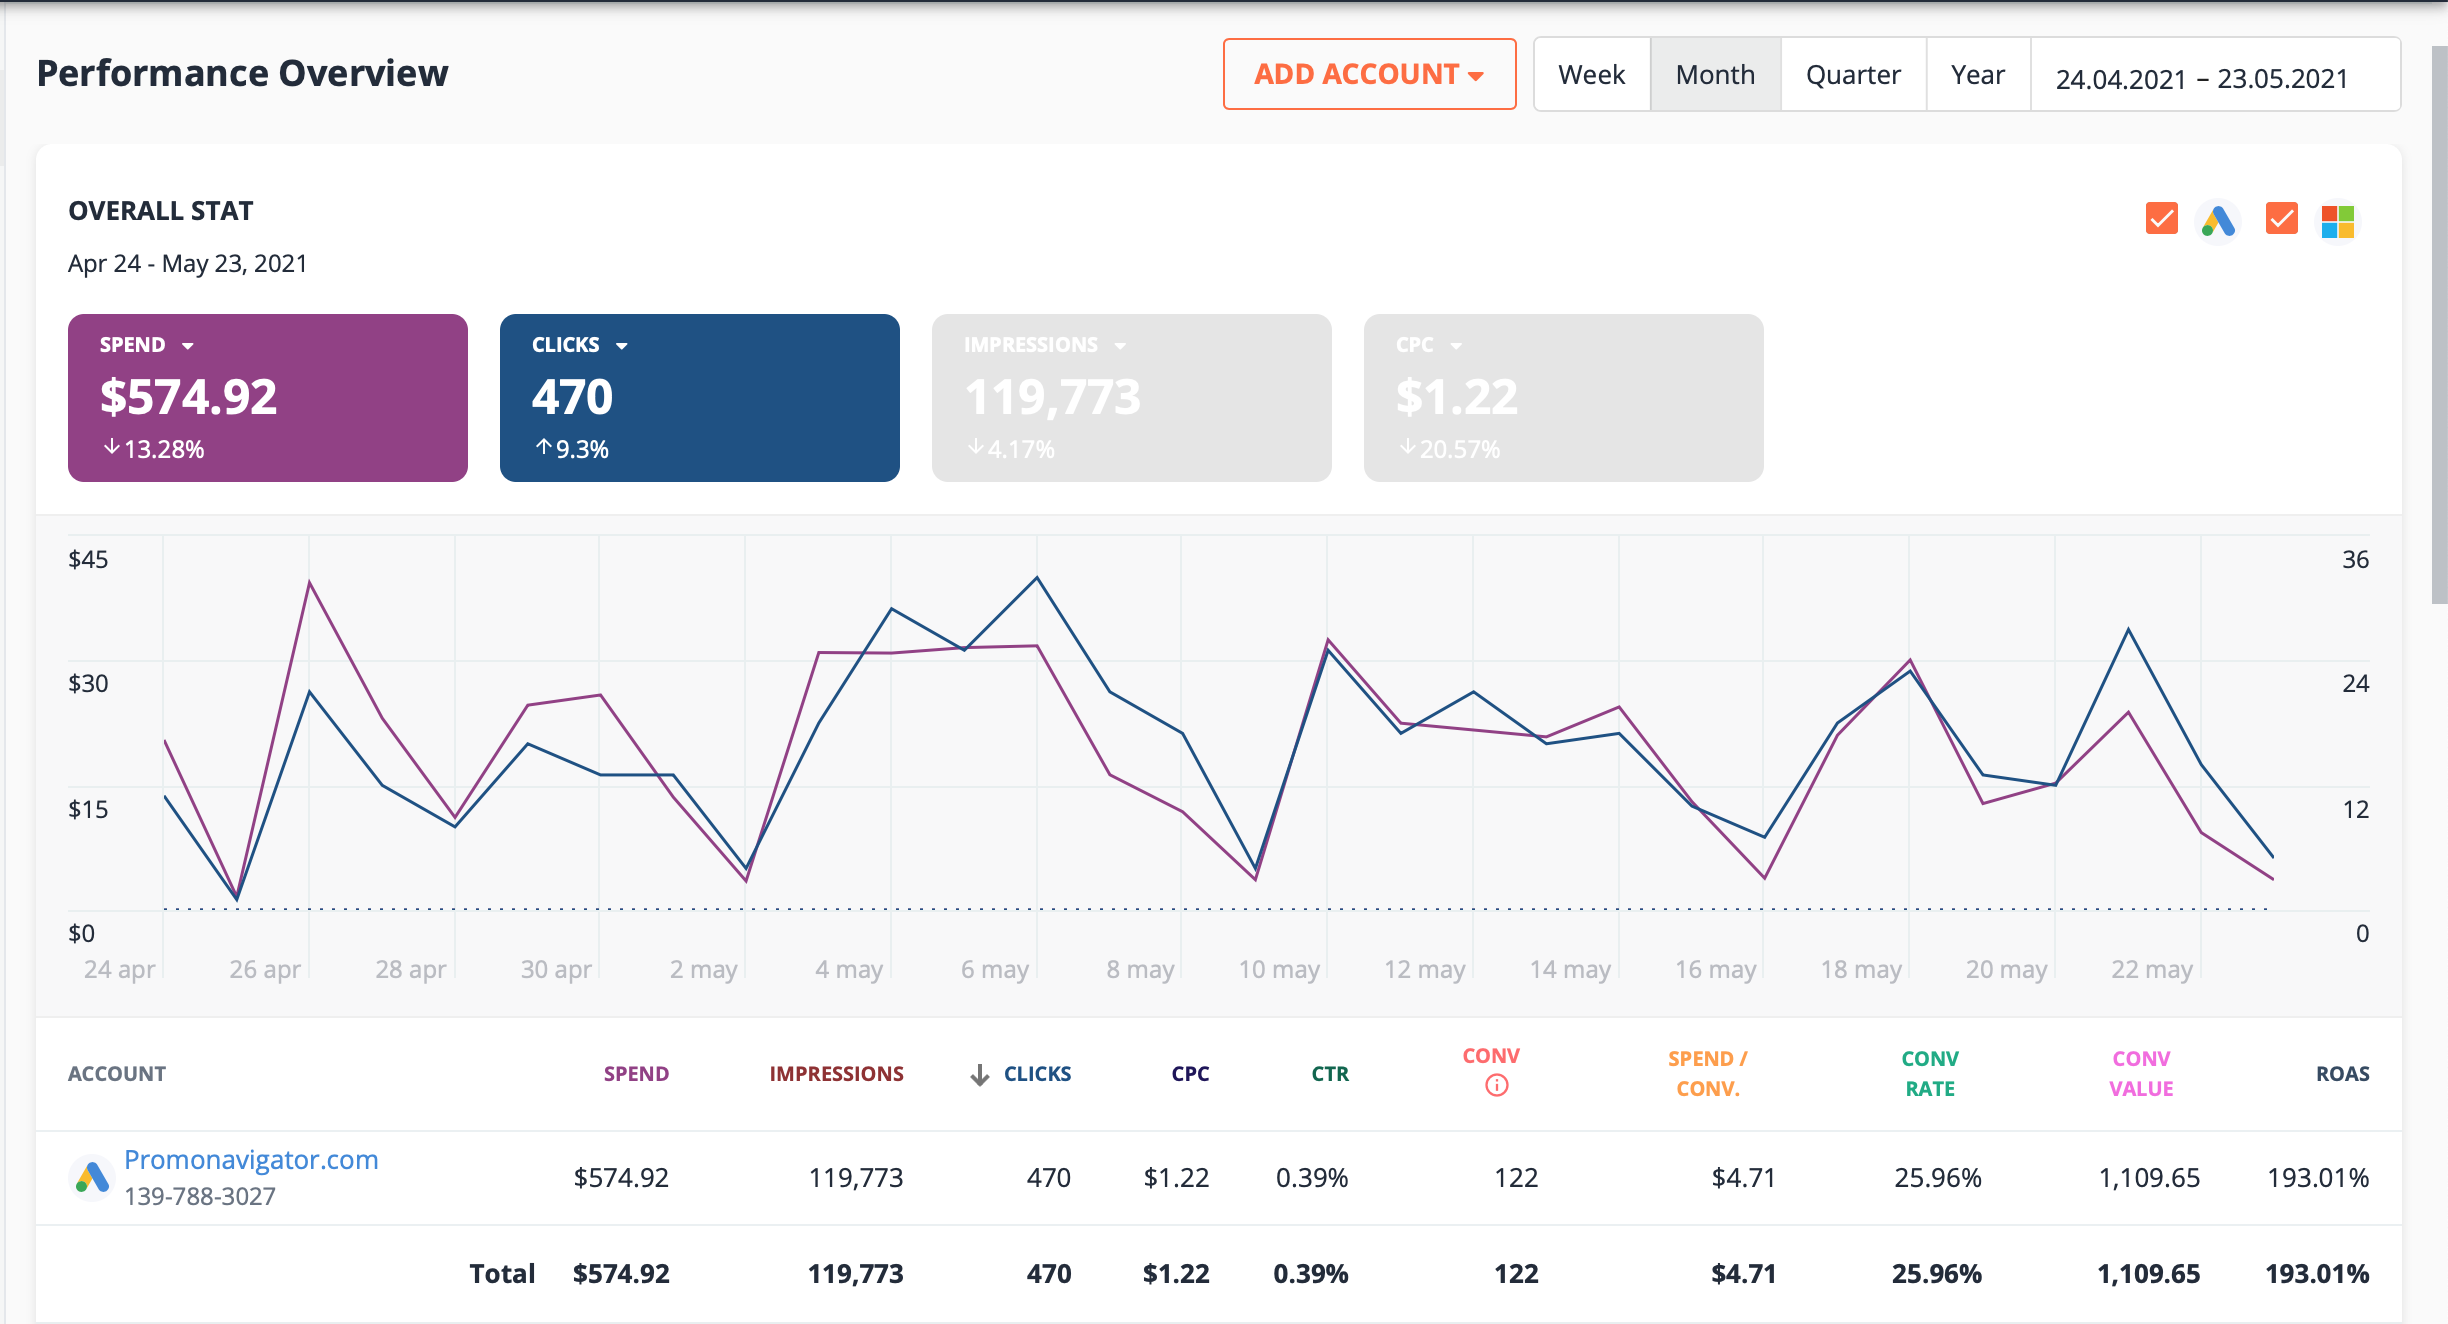
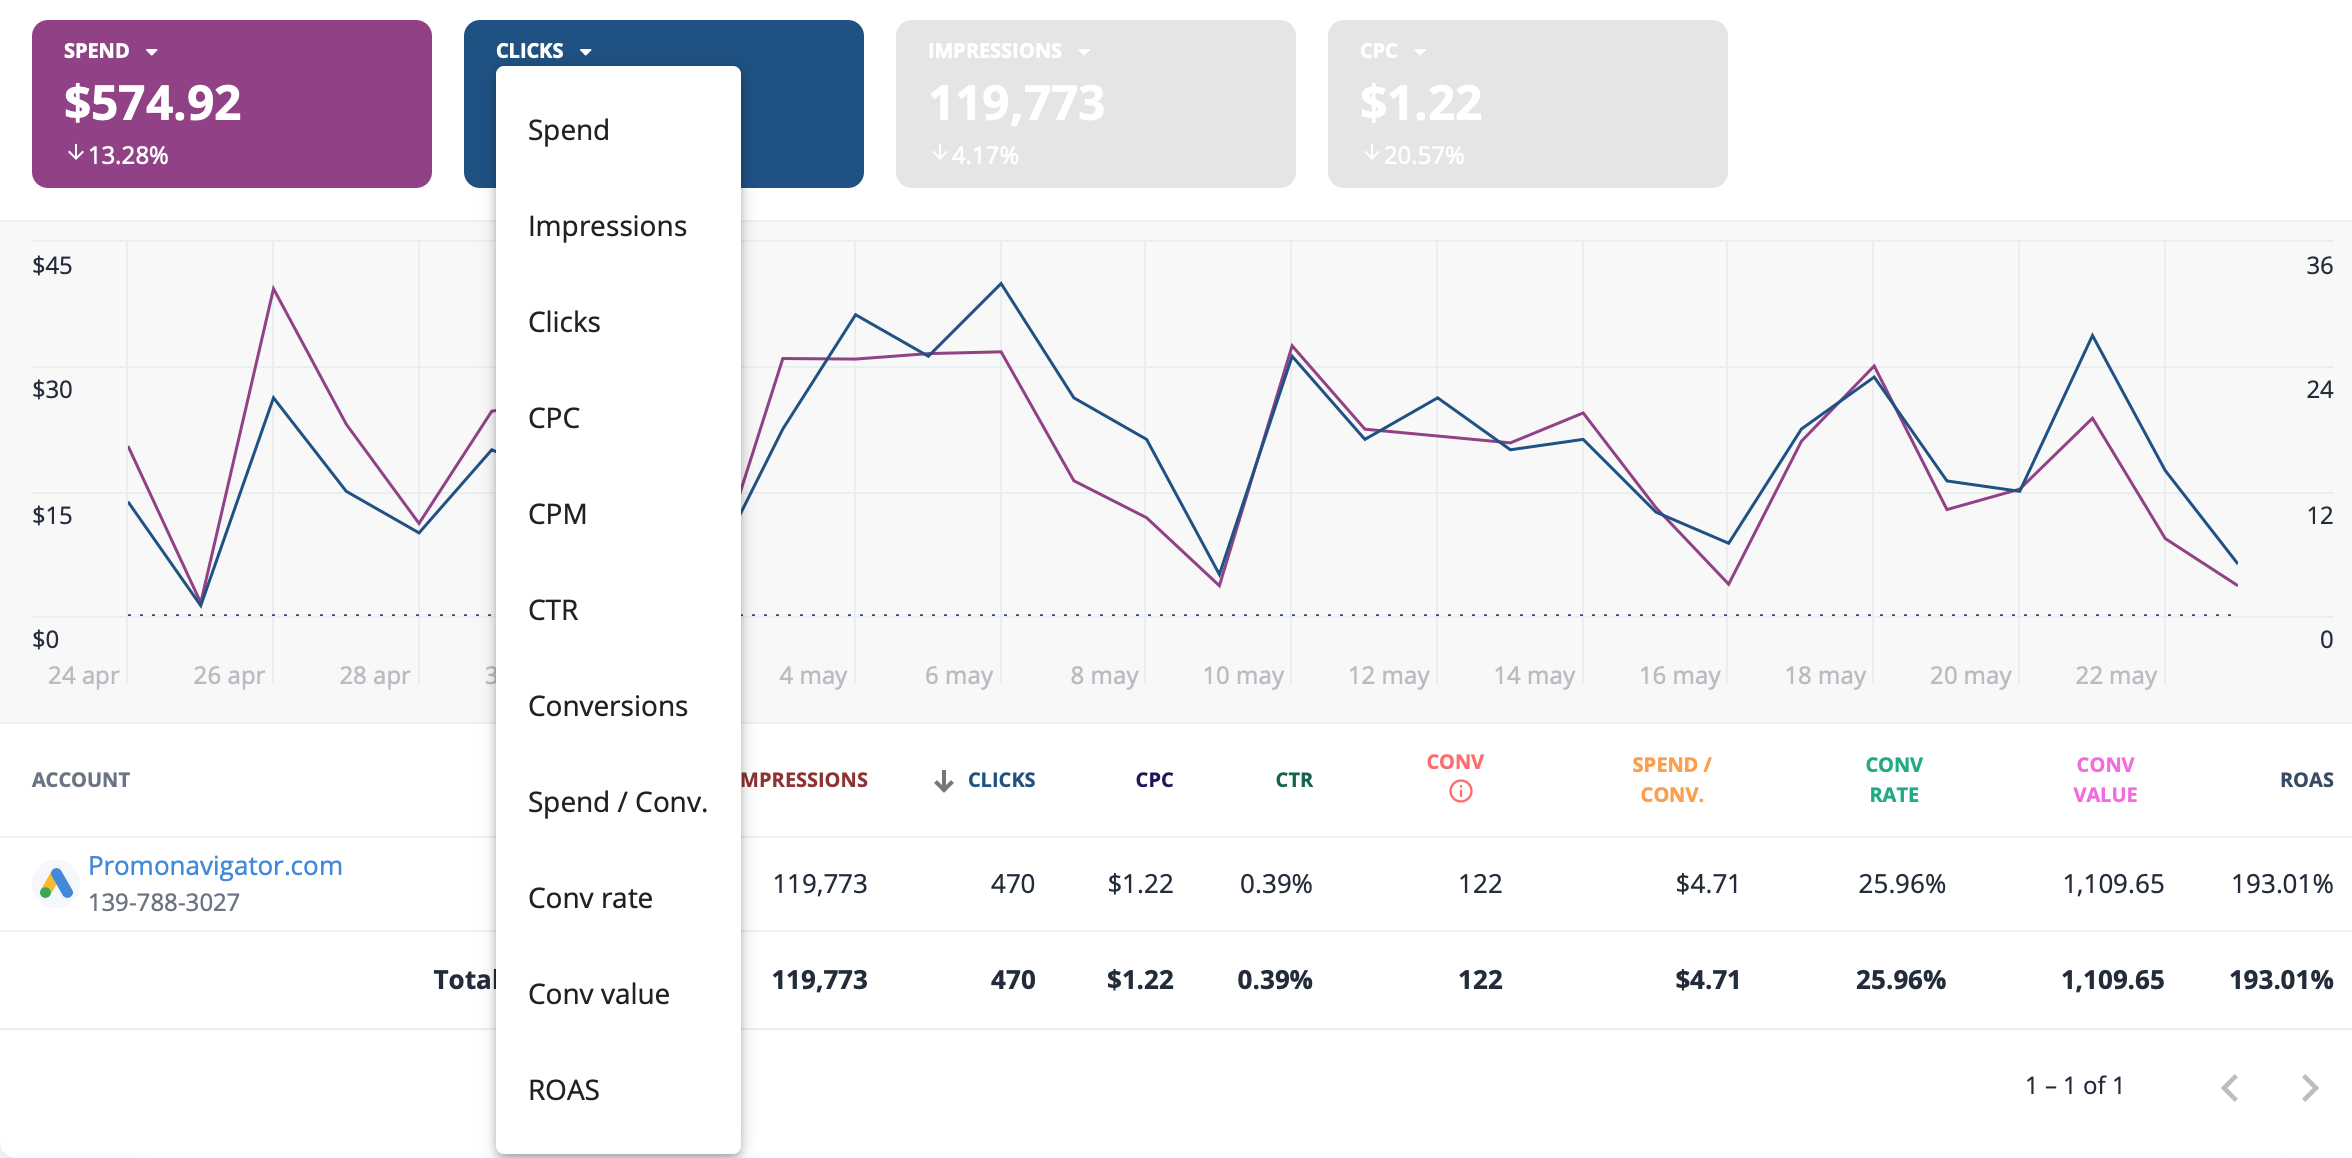
The overall statistics of your campaign are displayed in the chart on the dashboard, and below, the information can be read manually. It is possible to display different information on the dashboard. You may select one of the 11 key performance indicators from the drop-down list and add up to 4 indicators at once to the dashboard.
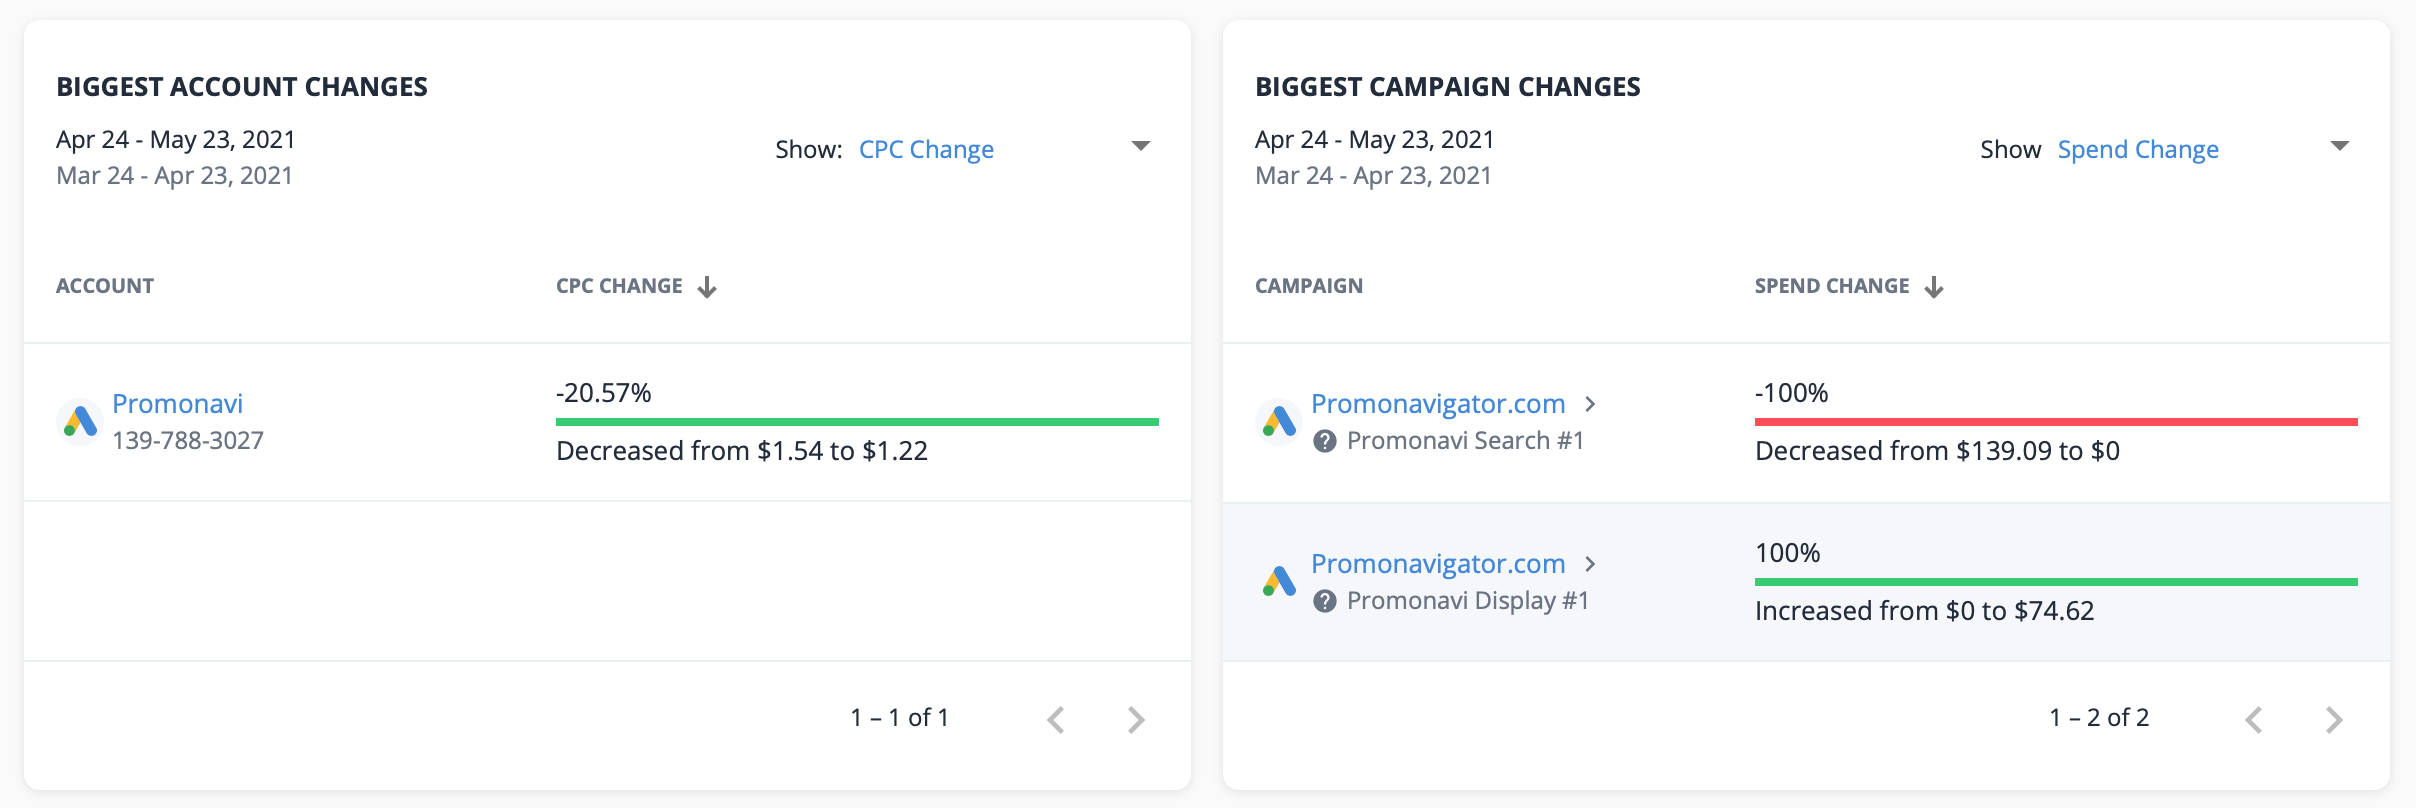
Below, it is possible to quickly get an overview of the biggest account and campaign changes. Also, here, it is possible to choose the key performance indicator from the drop down list that contains 11 key performance indicators.
When clicking on a campaign from the table below the chart, you have the possibility to dive deeper into the key performance indicators of the campaign. You can get statistics about what you have running and make a comparison.
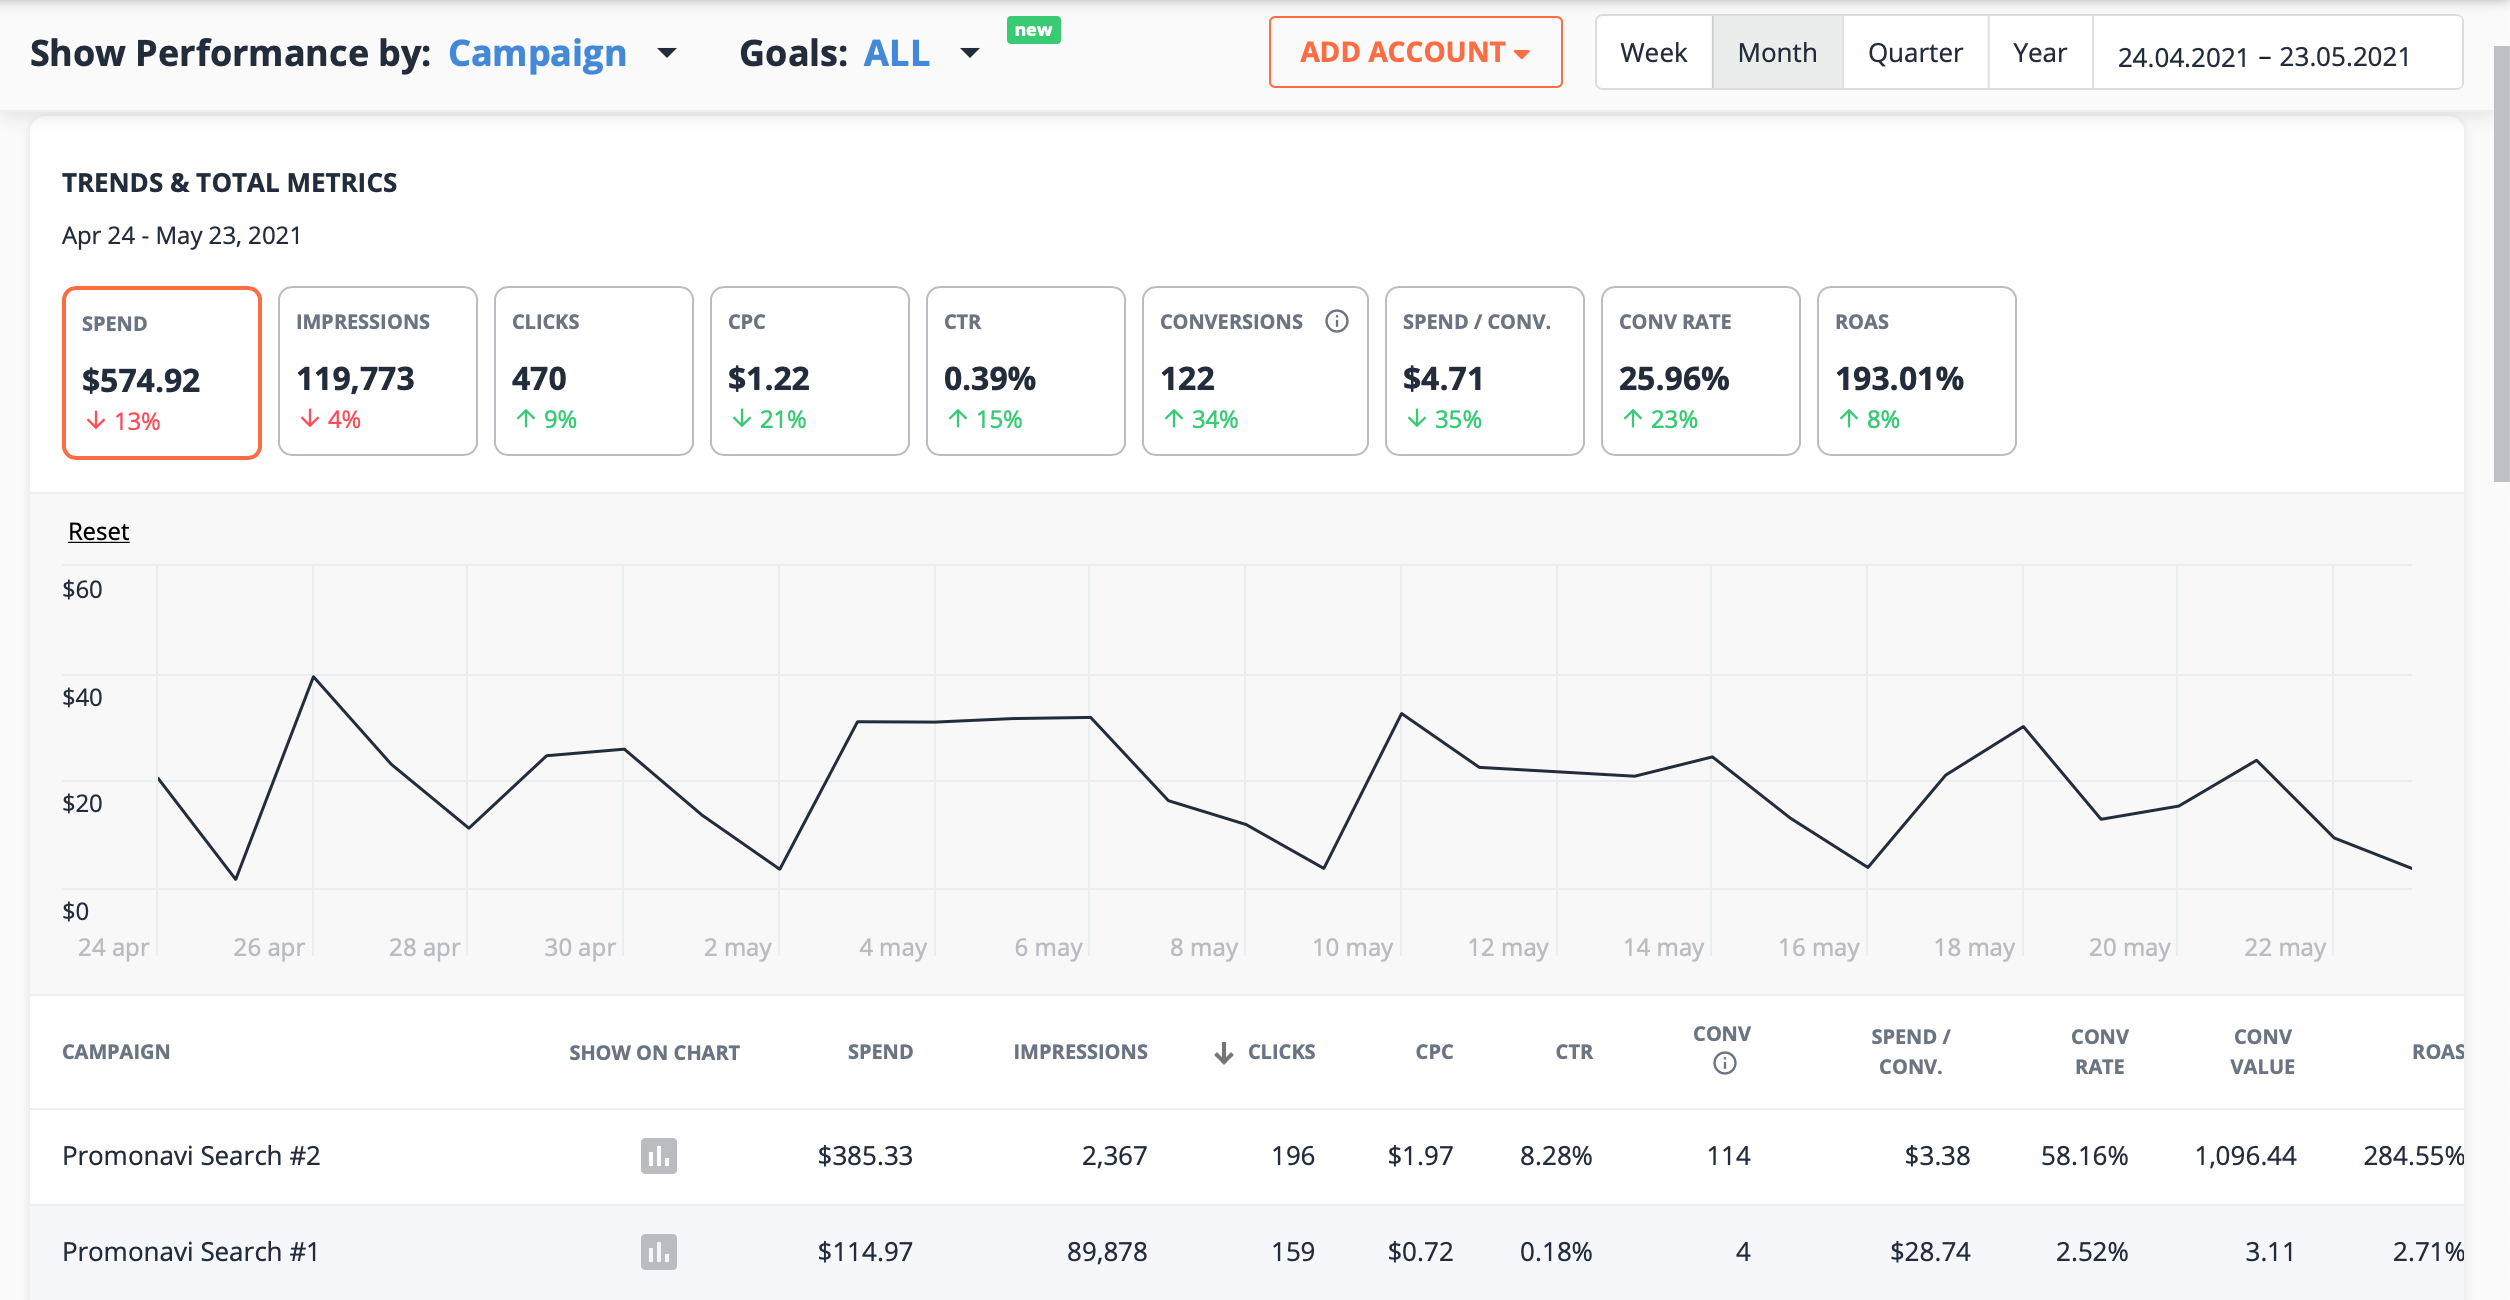
Besides of seeing the performance by campaign, you can also check your performance by device, age, gender and network from the drop down list at “show performance by”. In addition, you can select the goal that you have set up by yourself in Google and see how your campaigns are doing based on your goal.
