1. What Is the Tool For
 We’ve created the Google Ads Reports tool to simplify the reporting process for digital agencies. The tool transforms manual reporting into a fully automated workflow process.
The Google Ads Reports tool generates and sends Google Ads performance PDF reports by email weekly or monthly.
The tool is helpful both for clients and PPC managers. Clients receive comprehensive reports on their ad campaigns with such business-oriented metrics as Money Spent, Conversion Rate, and Cost per Conversion. They also see what works were done on their account and how the campaign performs compared to competitors.
The tool is beneficial for PPC managers as well. With Google Ads Reports, they get a quick campaign overview without visiting Google Ads account. The competitor analysis feature is helpful when it comes to tracking competitor activity.
2. Short List of Key Features

- Automatically generated weekly / monthly reports for selected accounts.
- Competitor performance analysis.
- The Work Done section.
- Sending reports to the selected email addresses.
- There are four language versions: English, Italian, Spanish, and Russian (other languages we can add on request.)
- Reports personalization by adding your custom logo.
3. How to Create a New Report
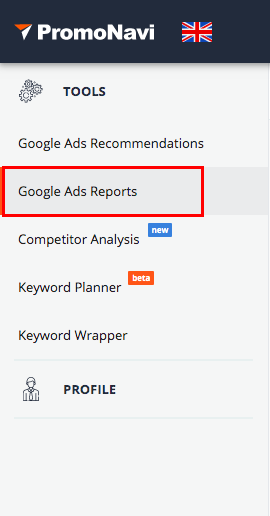
Select the Google Ads Report tool in the toolbar on the left.
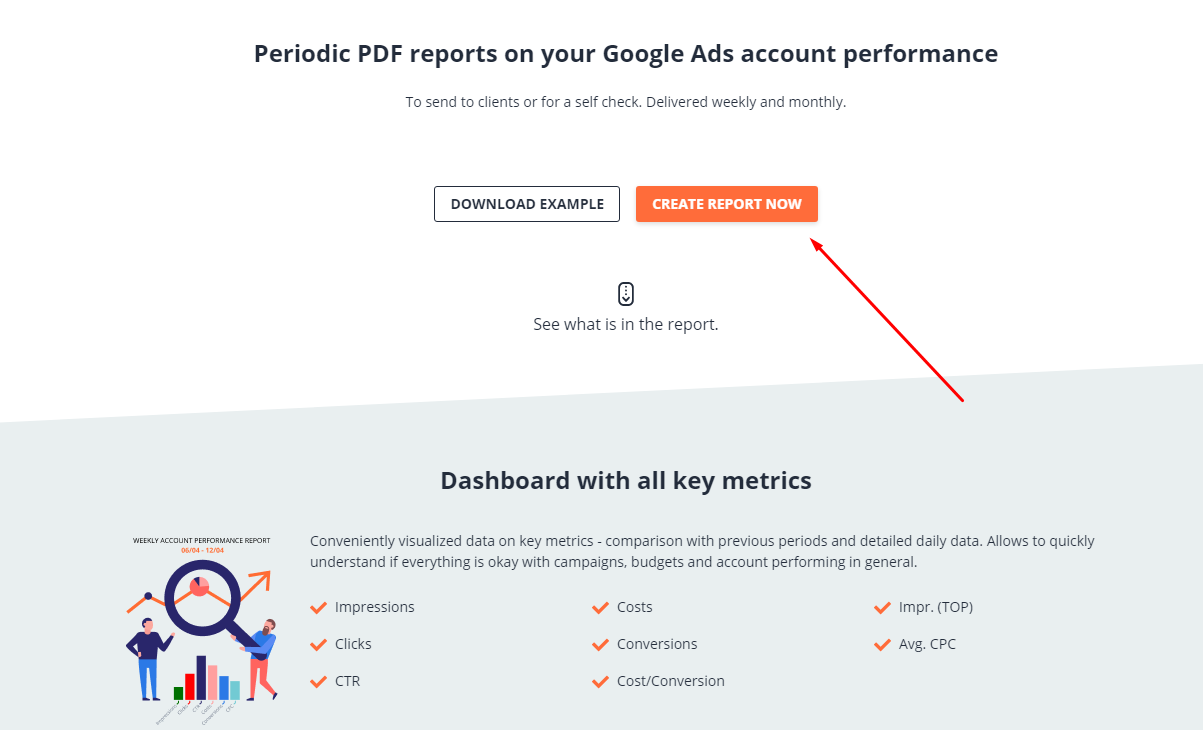
Open the tool and press the CREATE NEW REPORT button.
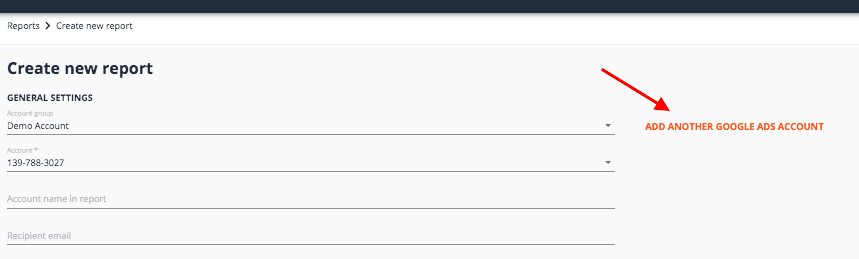
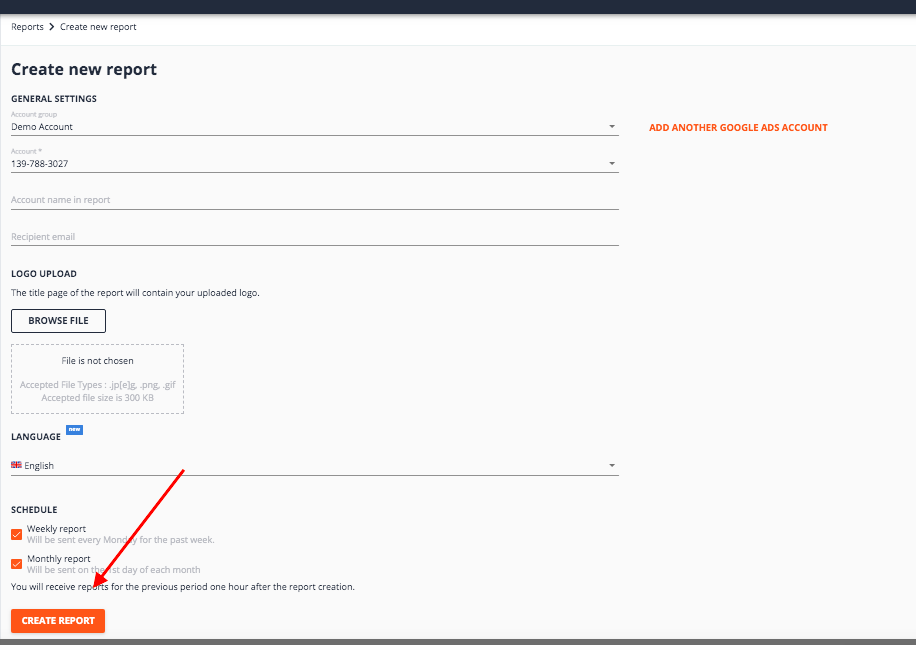
Choose the account group (your MCC) and the account for which you want to generate the report.
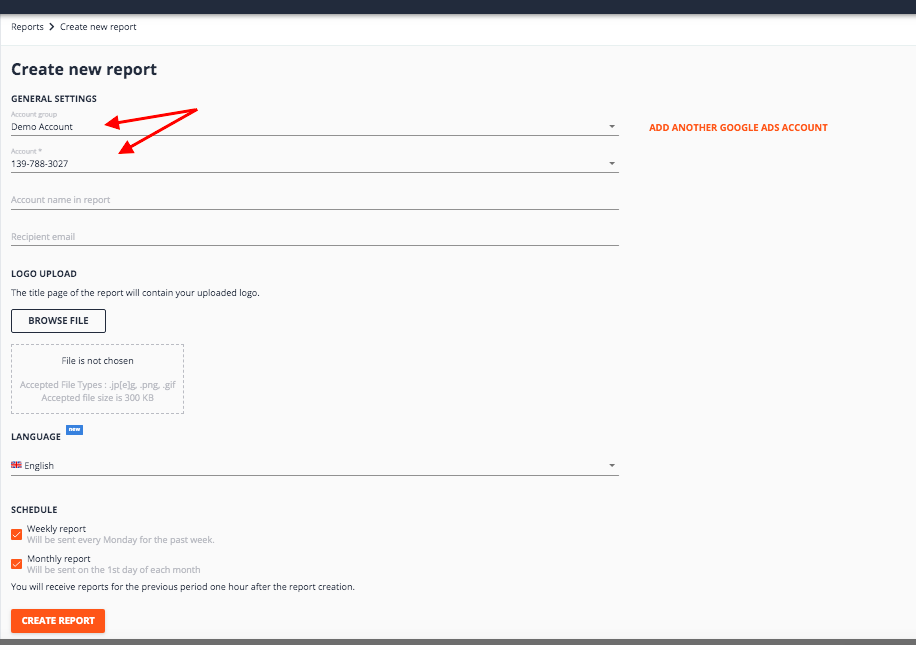
You can also connect an additional Google Ads account to generate reports on it.
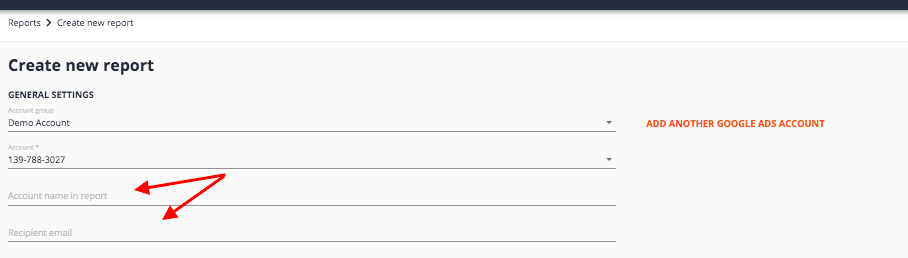
Enter the account name and an email you want to get the reports.
The account name will be used as the title of your PDF report and the email.
You can also upload a logo to personalize your report. This logo will be placed on the title page of the report.
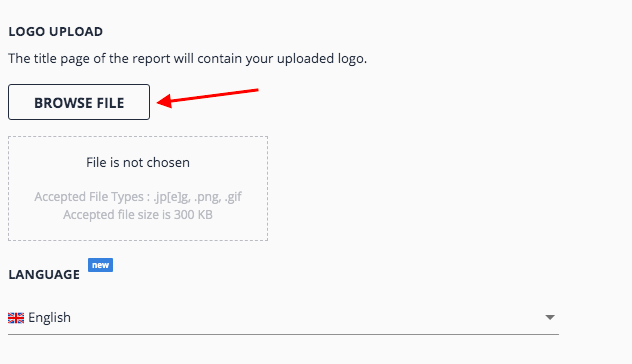
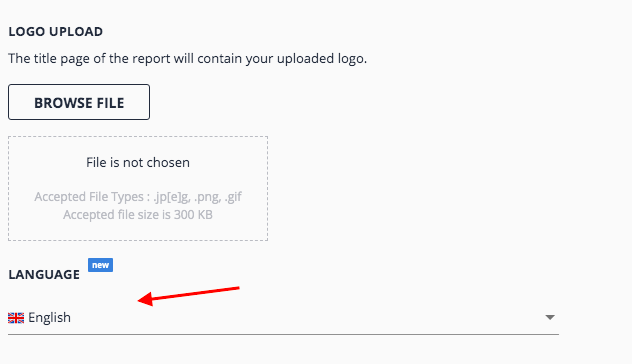
Your Google Ads Report can be in English, Russian, Italian, or Spanish.
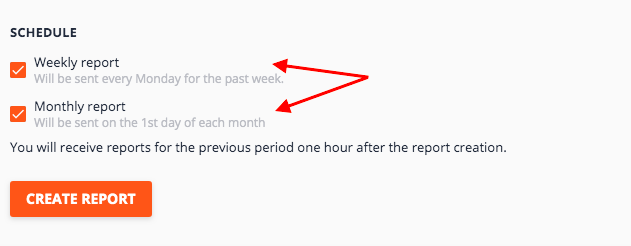
The report can be sent once per week or/and once per month.
A weekly report is sent every Monday and contains data for the past week.
A Monthly report is sent on the first day of the month. It contains metrics for the previous month.
You receive the first weekly and monthly report one hour after its creation. Note that this report doesn’t contain Competitors Analysis and Work Done History sections. They’ll be available in the following week report.
Once you’ve adjusted the settings, press the CREATE REPORT button.
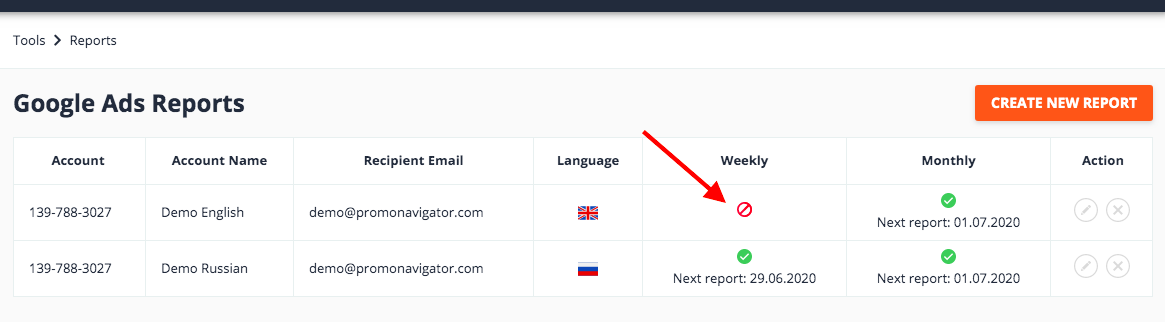
You will see a new report on the Reports dashboard.
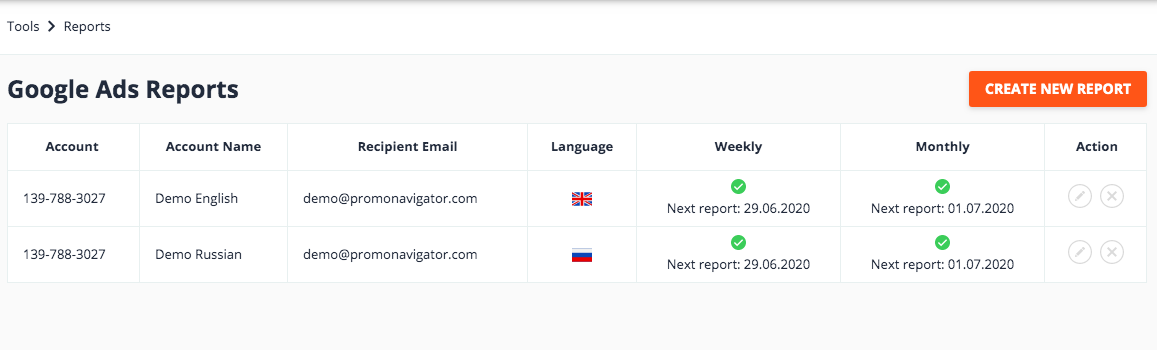
The Weekly and Monthly columns contain the next reporting dates.
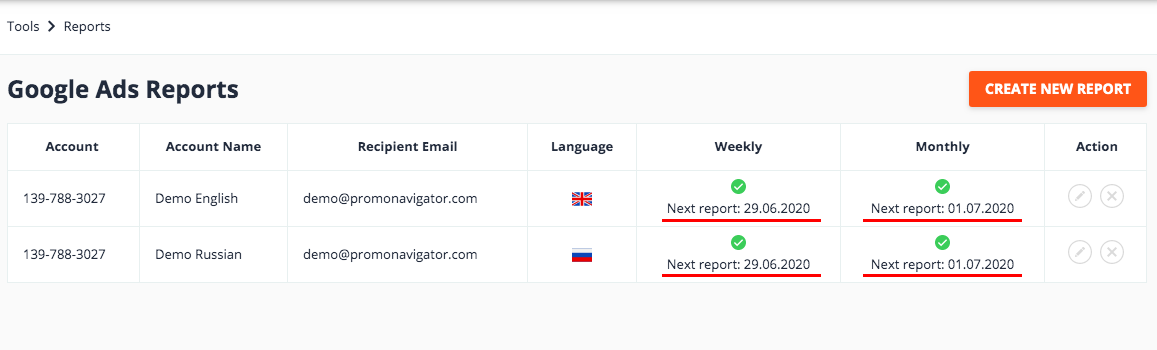
If the report is disabled, you’ll see this red icon in the table.
You can create several reports for any Google Ads account and send them to different emails.
Note! If you unlink your Google Ads account from PromoNavi, all the related Google Ads reports will be deleted.
4. How to Manage Your Reports
You can manage your reports from the dashboard.
To change the report settings, click the pencil icon.
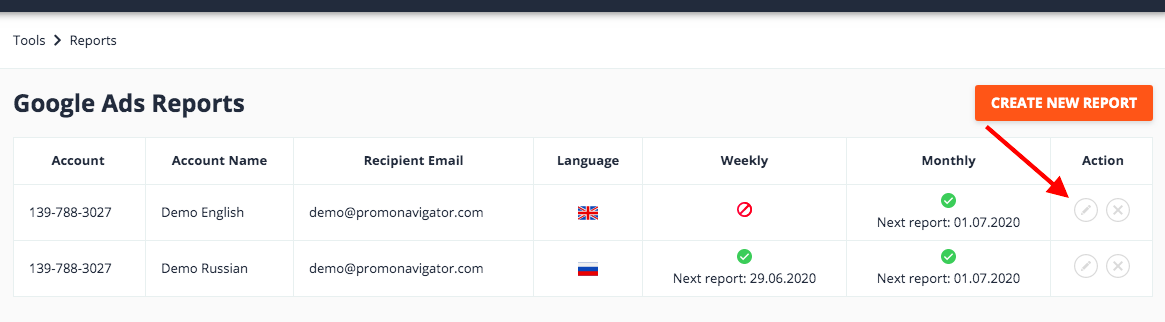
You can change report settings and scheduling in the Edit report section.
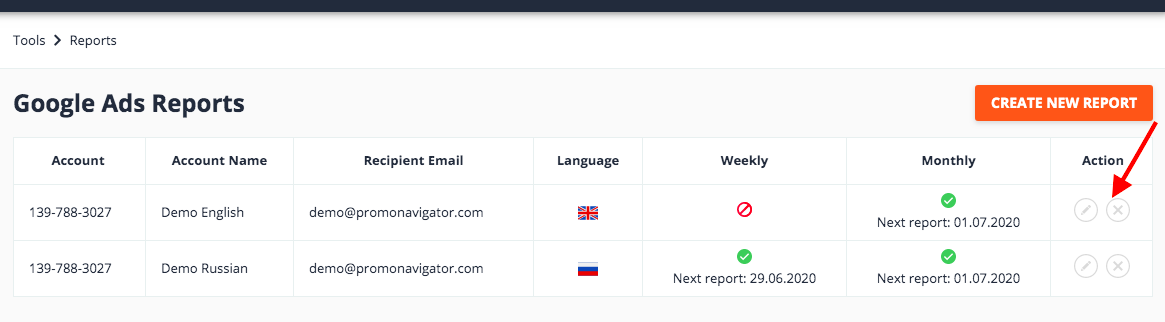
If you want to delete a report, click the “X” icon.
5. What Data is Available in the Report
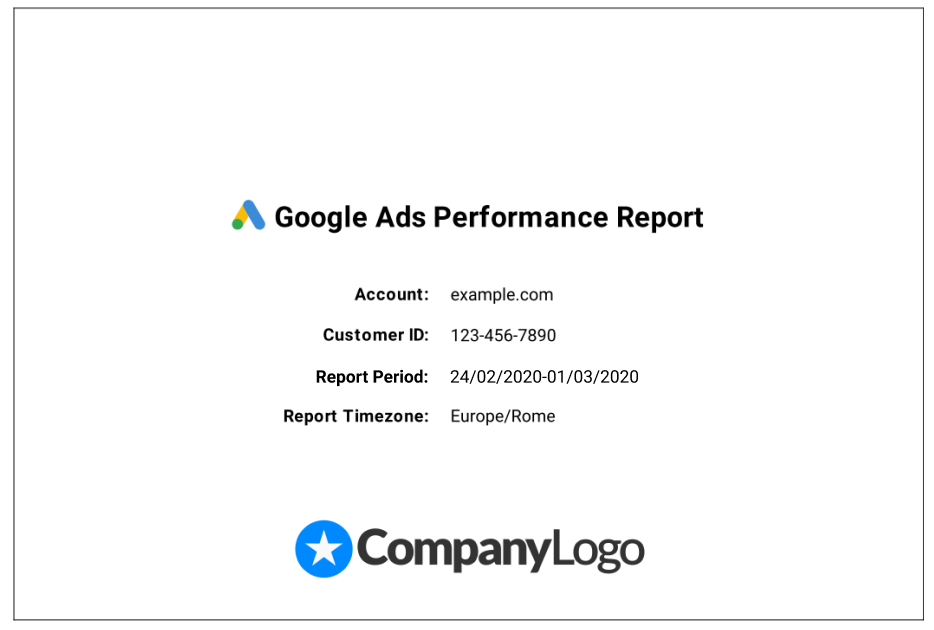
The title page of the report contains the account name, customer ID, reporting period, report timezone, and logo (if available.)
On the first page, you’ll find an overview of the account performance. This page contains general metrics: Impressions, CTR, Conversions, Imp. (Top,) Clicks, Cost, Cost per conversion, and average CPC.
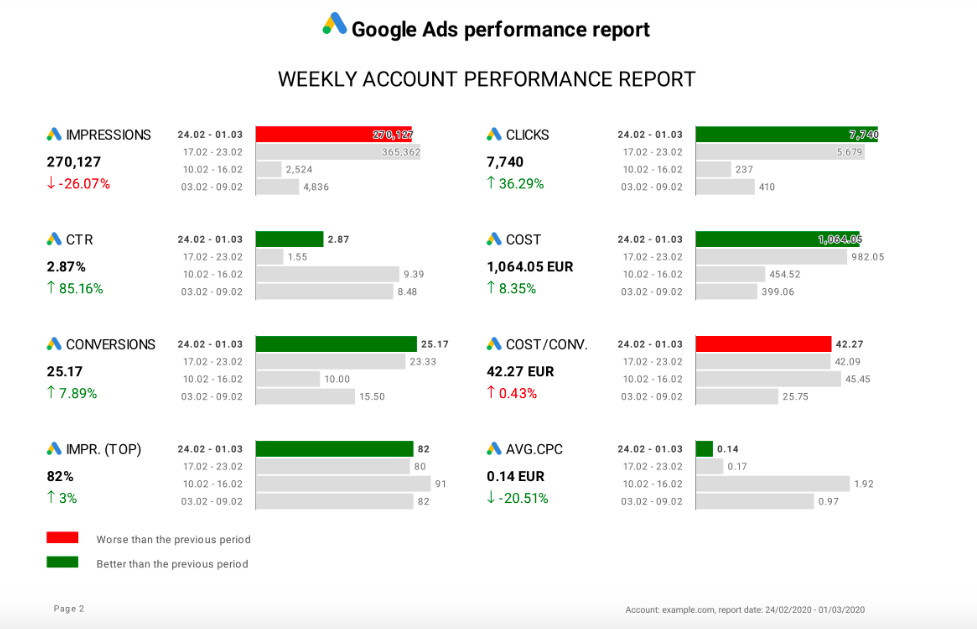
The metrics are compared with the previous three reporting periods (three weeks for weekly reports and three months for monthly reports.)
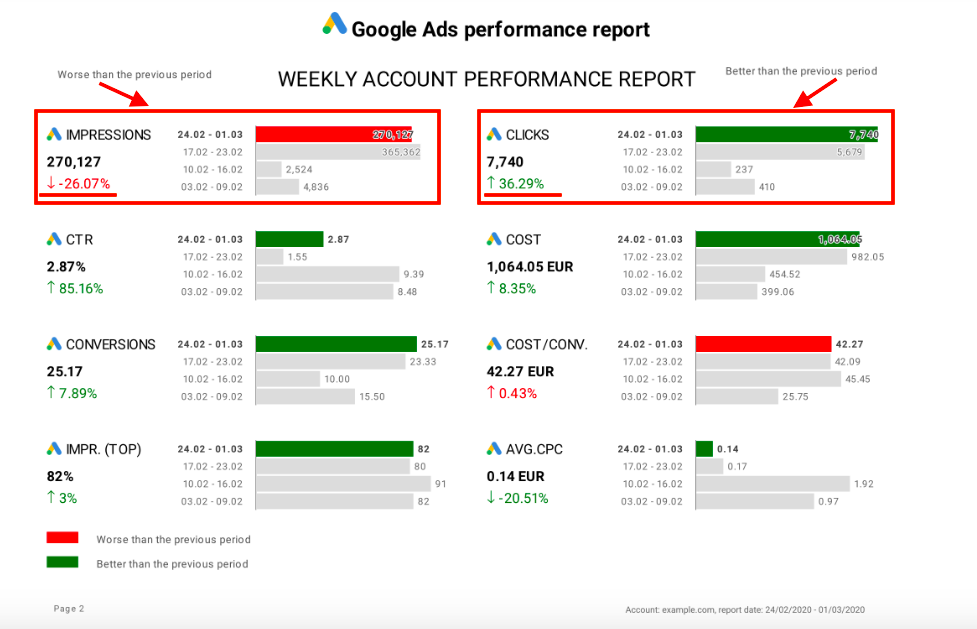
If the current period has outperformed the latest ones, the metric will be marked in green. If its performance has been worse, it will be marked in red. This gives a fast overview of the campaign’s performance and shows where you need to pay attention to.
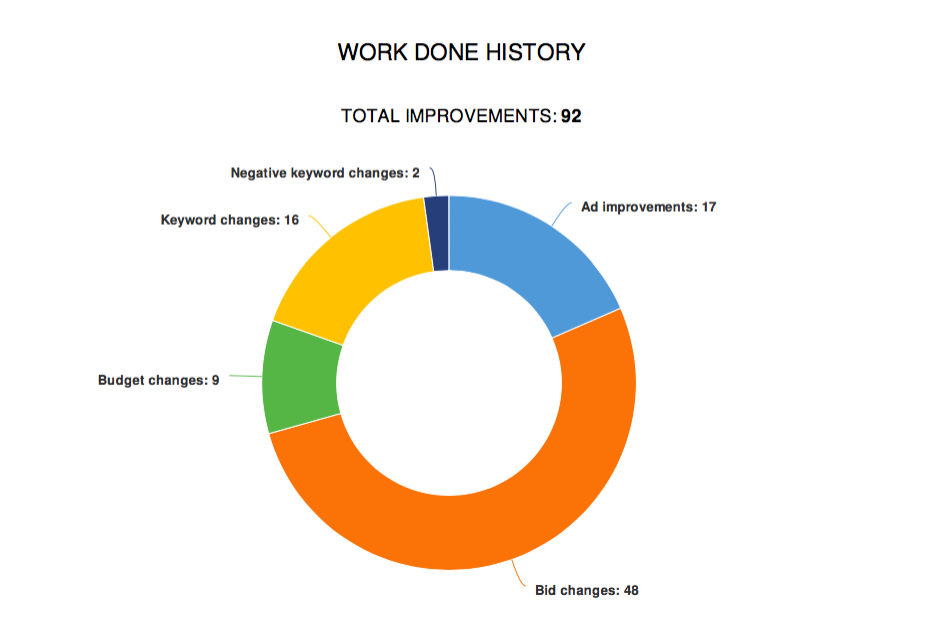
The next two pages represent what works were done over the reporting period. They contain charts with a comprehensive visualization of your work, saving time and effort for your PPC and account managers.
The system creates a diagram of the improvements made to the campaign, e.g., budget changes, bid changes, keyword changes, negative keyword changes, and ad improvements.
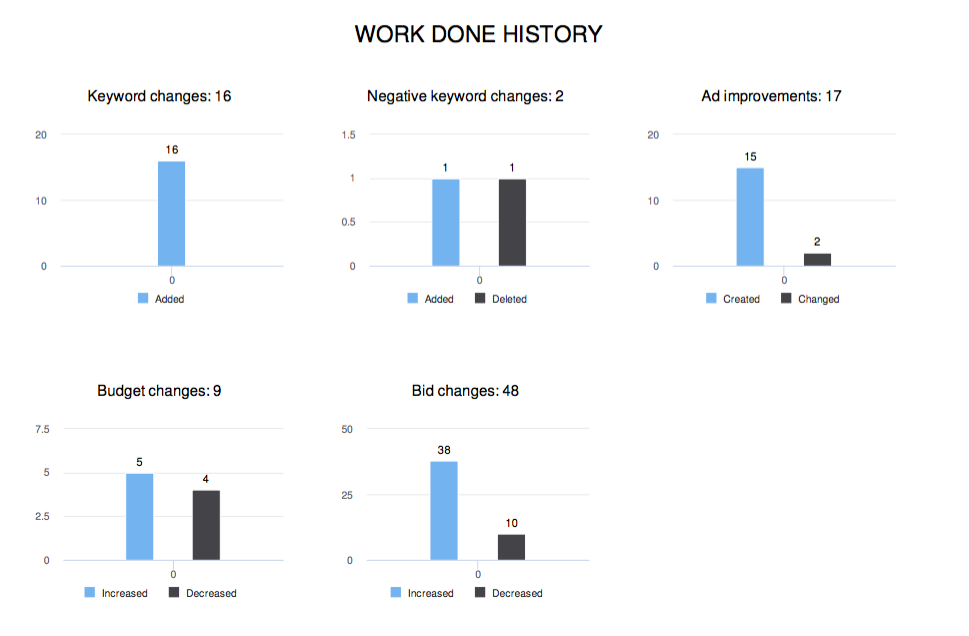
On the next page, we see the Work Done History details:
- How many keywords and negative keywords were added and deleted
- How many ad improvements were applied
- How many times the budget and the bids were changed
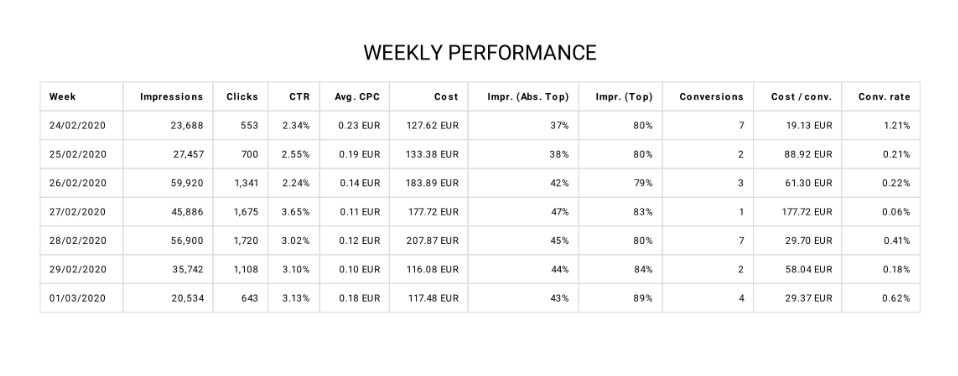
On the weekly or monthly performance page, there are metrics for each day of the week or month: Impressions, Clicks, Average CPC, Cost, Impr. (Abs. Top,) Conversions, Cost per Conversion, and Conversion Rate.
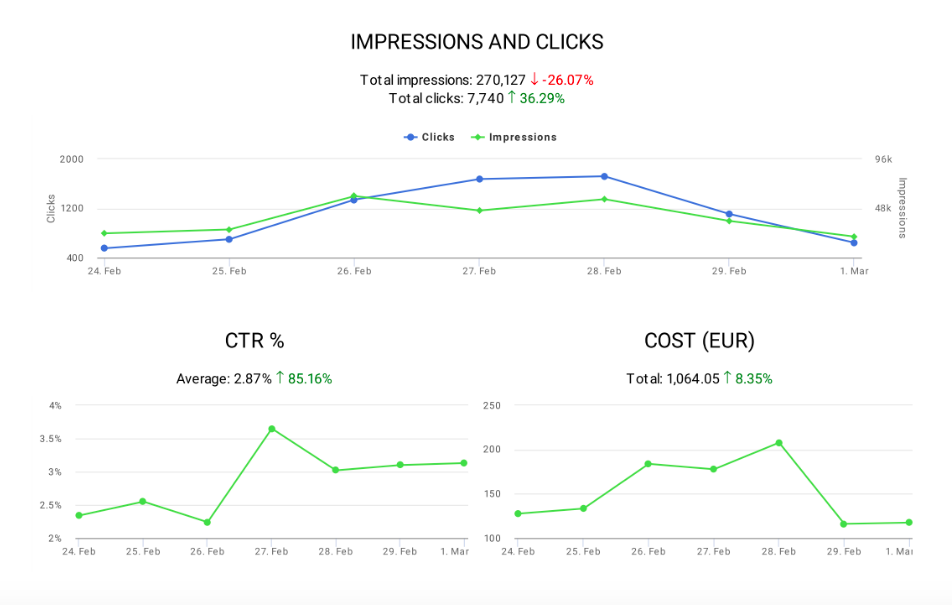
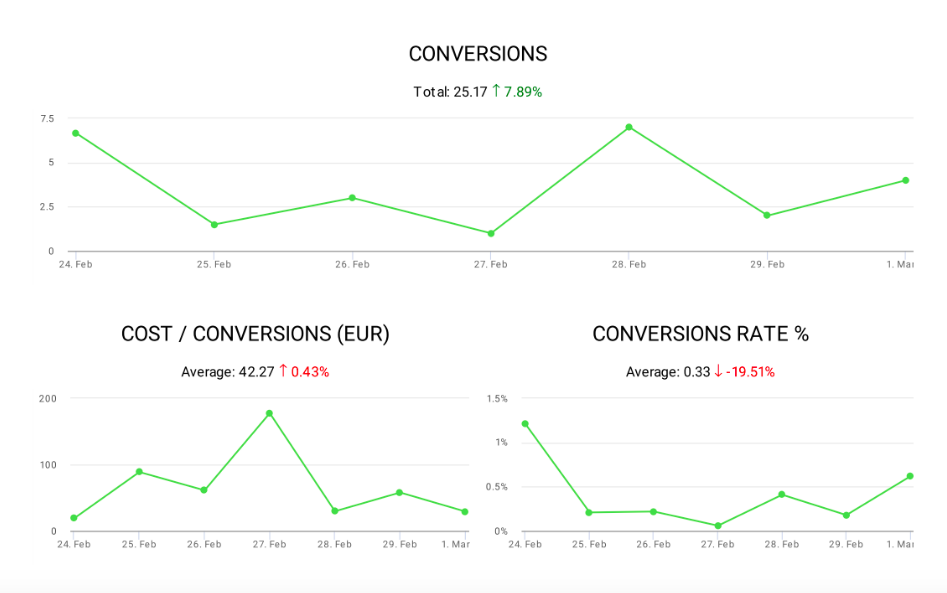
The next pages aggregate the weekly or monthly dynamics for the following metrics: Impressions and Clicks, CTR, Cost, Conversions, Cost per Conversion, Conversion Rate.
The next section of the report outlines competitor performance/activities.
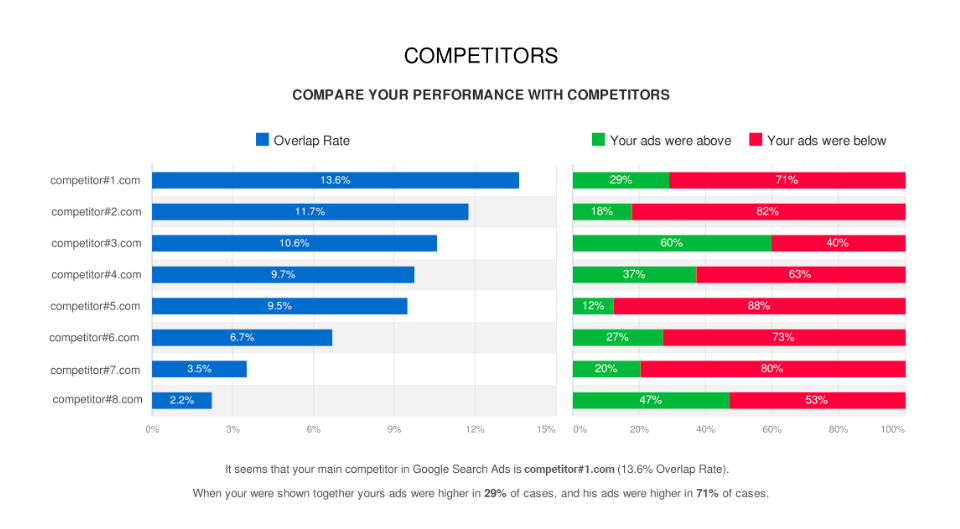
The left column shows an overlap rate for yours and your competitors’ campaigns. The main competitor is the one with the highest overlap rate.
The right column compares your ad’s position to the ones of the competitors. Green highlighting means that your ads were above, and the red one, says they were below.
In this example, we can see that the main competitor in Google Search Ads is competitor#1.com. Compared with each other, your ads were higher in 29 % of cases, and his ads ranked higher in 71 % of cases.
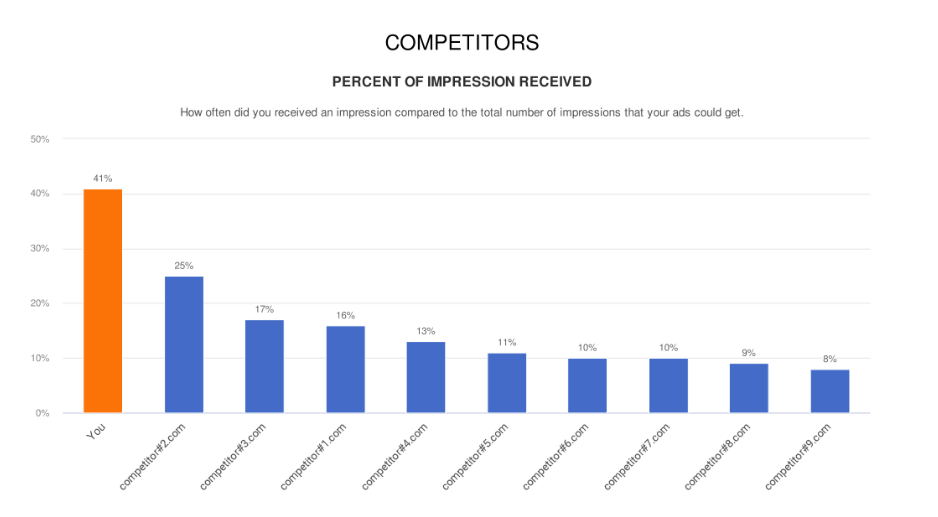
The next page shows how often you received an impression compared to the total number of impressions that your ads could get (% of Impressions Received.) You can compare your performance with your competitors.
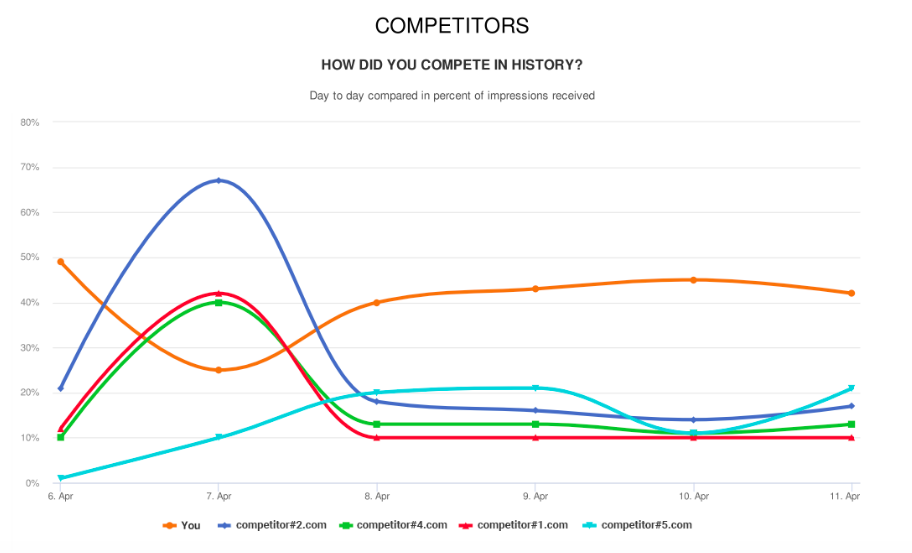
Another page in the Competitor Analysis section shows the day-by-day Impressions change for you and your competitor’s ads (% of Impressions Received.)
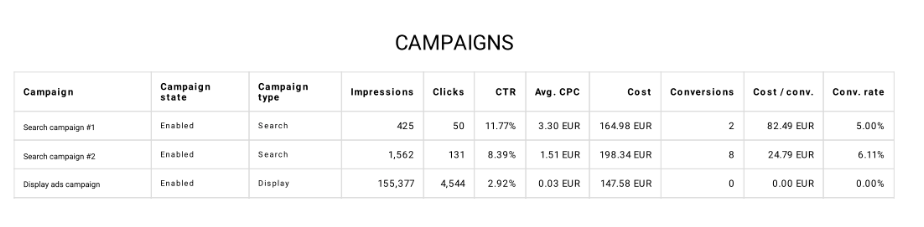
If you are running several campaigns, the next page will contain a summary of each one:
- Campaign name and status (Еnabled / Disabled)
- Campaign type (Search / Display)
- Impressions, Clicks, CTR, Average CPC, Cost, Conversions, Cost per Conversion, and Conversion Rate
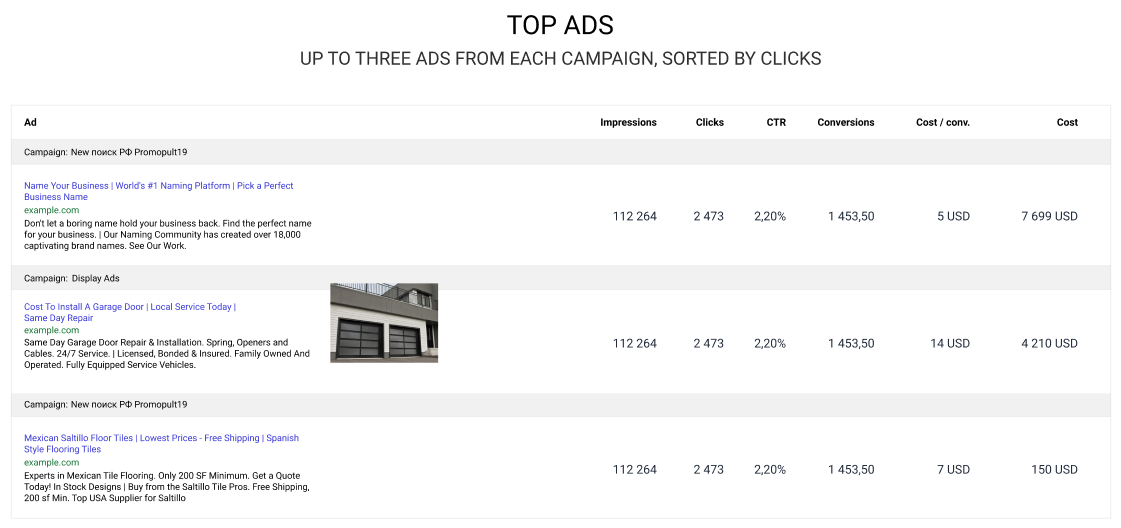
The report ends with a section featuring the best performing ads for each campaign based on the main metrics: